The NHS South East London (SEL) Integrated Care System (ICS) has used innovative spatial analysis technology to identify the best sites for its first two women’s and girls’ health hubs.
Designed to improve access to services and reduce inequalities in women’s and girls’ health, the hubs are now offering a core range of services to deliver integrated care at neighbourhood level. The new facilities also meet the requirement to re-use existing buildings within the estate.
By examining service usage and demographic data across six boroughs, at the most granular level, precise locations in Lambeth and Greenwich were revealed that would benefit most patients and help improve outcomes.
NHS SE London’s data analytics team used Esri UK’s GIS (Geographic Information System) software to conduct the analysis instead of working with the usual isolated charts and tables. The new approach enabled disparate data to be integrated and patterns within the data to be easily seen, helping to understand access issues and support the final planning decisions.
For example, the software was used to visualise the burden of conditions such as fibroids and endometriosis at a neighbourhood level, which Alice Gough, Programme Manager, Women’s and Girls’ Health Hubs, SEL ICS and KHP (King’s Health Partners), describes as “invaluable.”
She explains: “It highlights unmet need and helps us shape our community outreach programmes and women’s and girls’ health hub service design around the communities that need it most.”
Designing the service
Lambeth’s hub currently operates as a virtual triage model, with plans to transition to an in-person hub based within an existing GP practice. The new Greenwich site is located within an existing community health centre alongside sexual, reproductive and contraception health services. Centrally located in the borough, it has easy access to transport links and serves an area of high deprivation.
The spatial analysis examined existing patient-level service usage, for long-acting reversible contraceptives, heavy menstrual bleeding and menopause treatments, in primary and secondary care, in addition to demographic data such as deprivation data, all at Lower Layer Super Output Areas (LSOAs) – the most granular data available. Journey time analysis was also considered to make the sites as accessible as possible. This allowed the analytics team to see which potential sites should be examined further, making use of existing buildings within the estate to optimise the use of space.
Jess Roe, Head of Analytics, Planning Directorate, NHS SE London, explains the value of LSOA mapping. “Mapping service usage by LSOA across all boroughs revealed exactly where hubs would reach the most people and have the highest impact. Interactive map dashboards visualised the data, while apps with time sliders showed change over time, which helps predict future service demand,” she says. “Location of the hubs is critical as they offer a more specialist offering than most GPs and give a single point of access to many different services. Geospatial analysis allows us to take a population health management approach to this.”
NHS SE London is using the same approach to evaluate service usage over time to monitor any changes in how and where the public are engaging with women’s health services. Results will help highlight low/high uptake of services within communities and further address any inequality in service delivery.
Duncan Booth is Head of Health and Social Care at Esri UK. He says: “Location is a powerful way of integrating disparate datasets to understand demand and plan new health services. Adopting a geospatial approach is increasingly delivering value across the NHS as more organisations move to digital to help reduce backlogs and increase prevention.”
Future plans for this project include looking at what new data could be added to the analysis, such as cervical screening, referrals to secondary care gynaecology services and sexual health data.
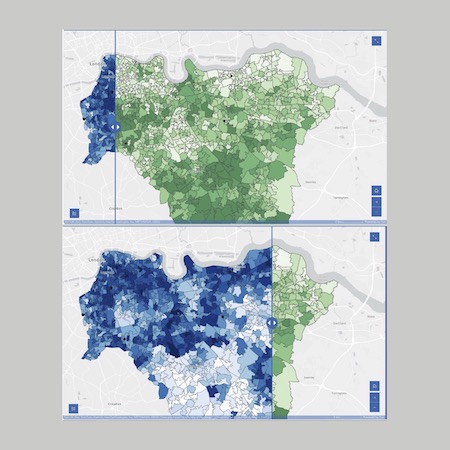
Image shows maps used to visualise HRT prescriptions vs deprivation. The darker blue represents the more deprived areas and darker green represents higher number of HRT prescriptions. The vertical slider allows easy comparison between the two.